
Extend analysis with your existing tools.
Bring connected production, feeding, and fish-health data into your BI dashboards and internal reports without manually combining source files every time.
MANOLIN API
Our API gives you a finished dataset to build on. Access cleaned production, feeding, fish-health, laboratory, environmental, and public data from Manolin in your own reporting tools, analytical environments, and applications.
Talk to us →Using Manolin's API
Bring connected production, feeding, and fish-health data into your BI dashboards and internal reports without manually combining source files every time.
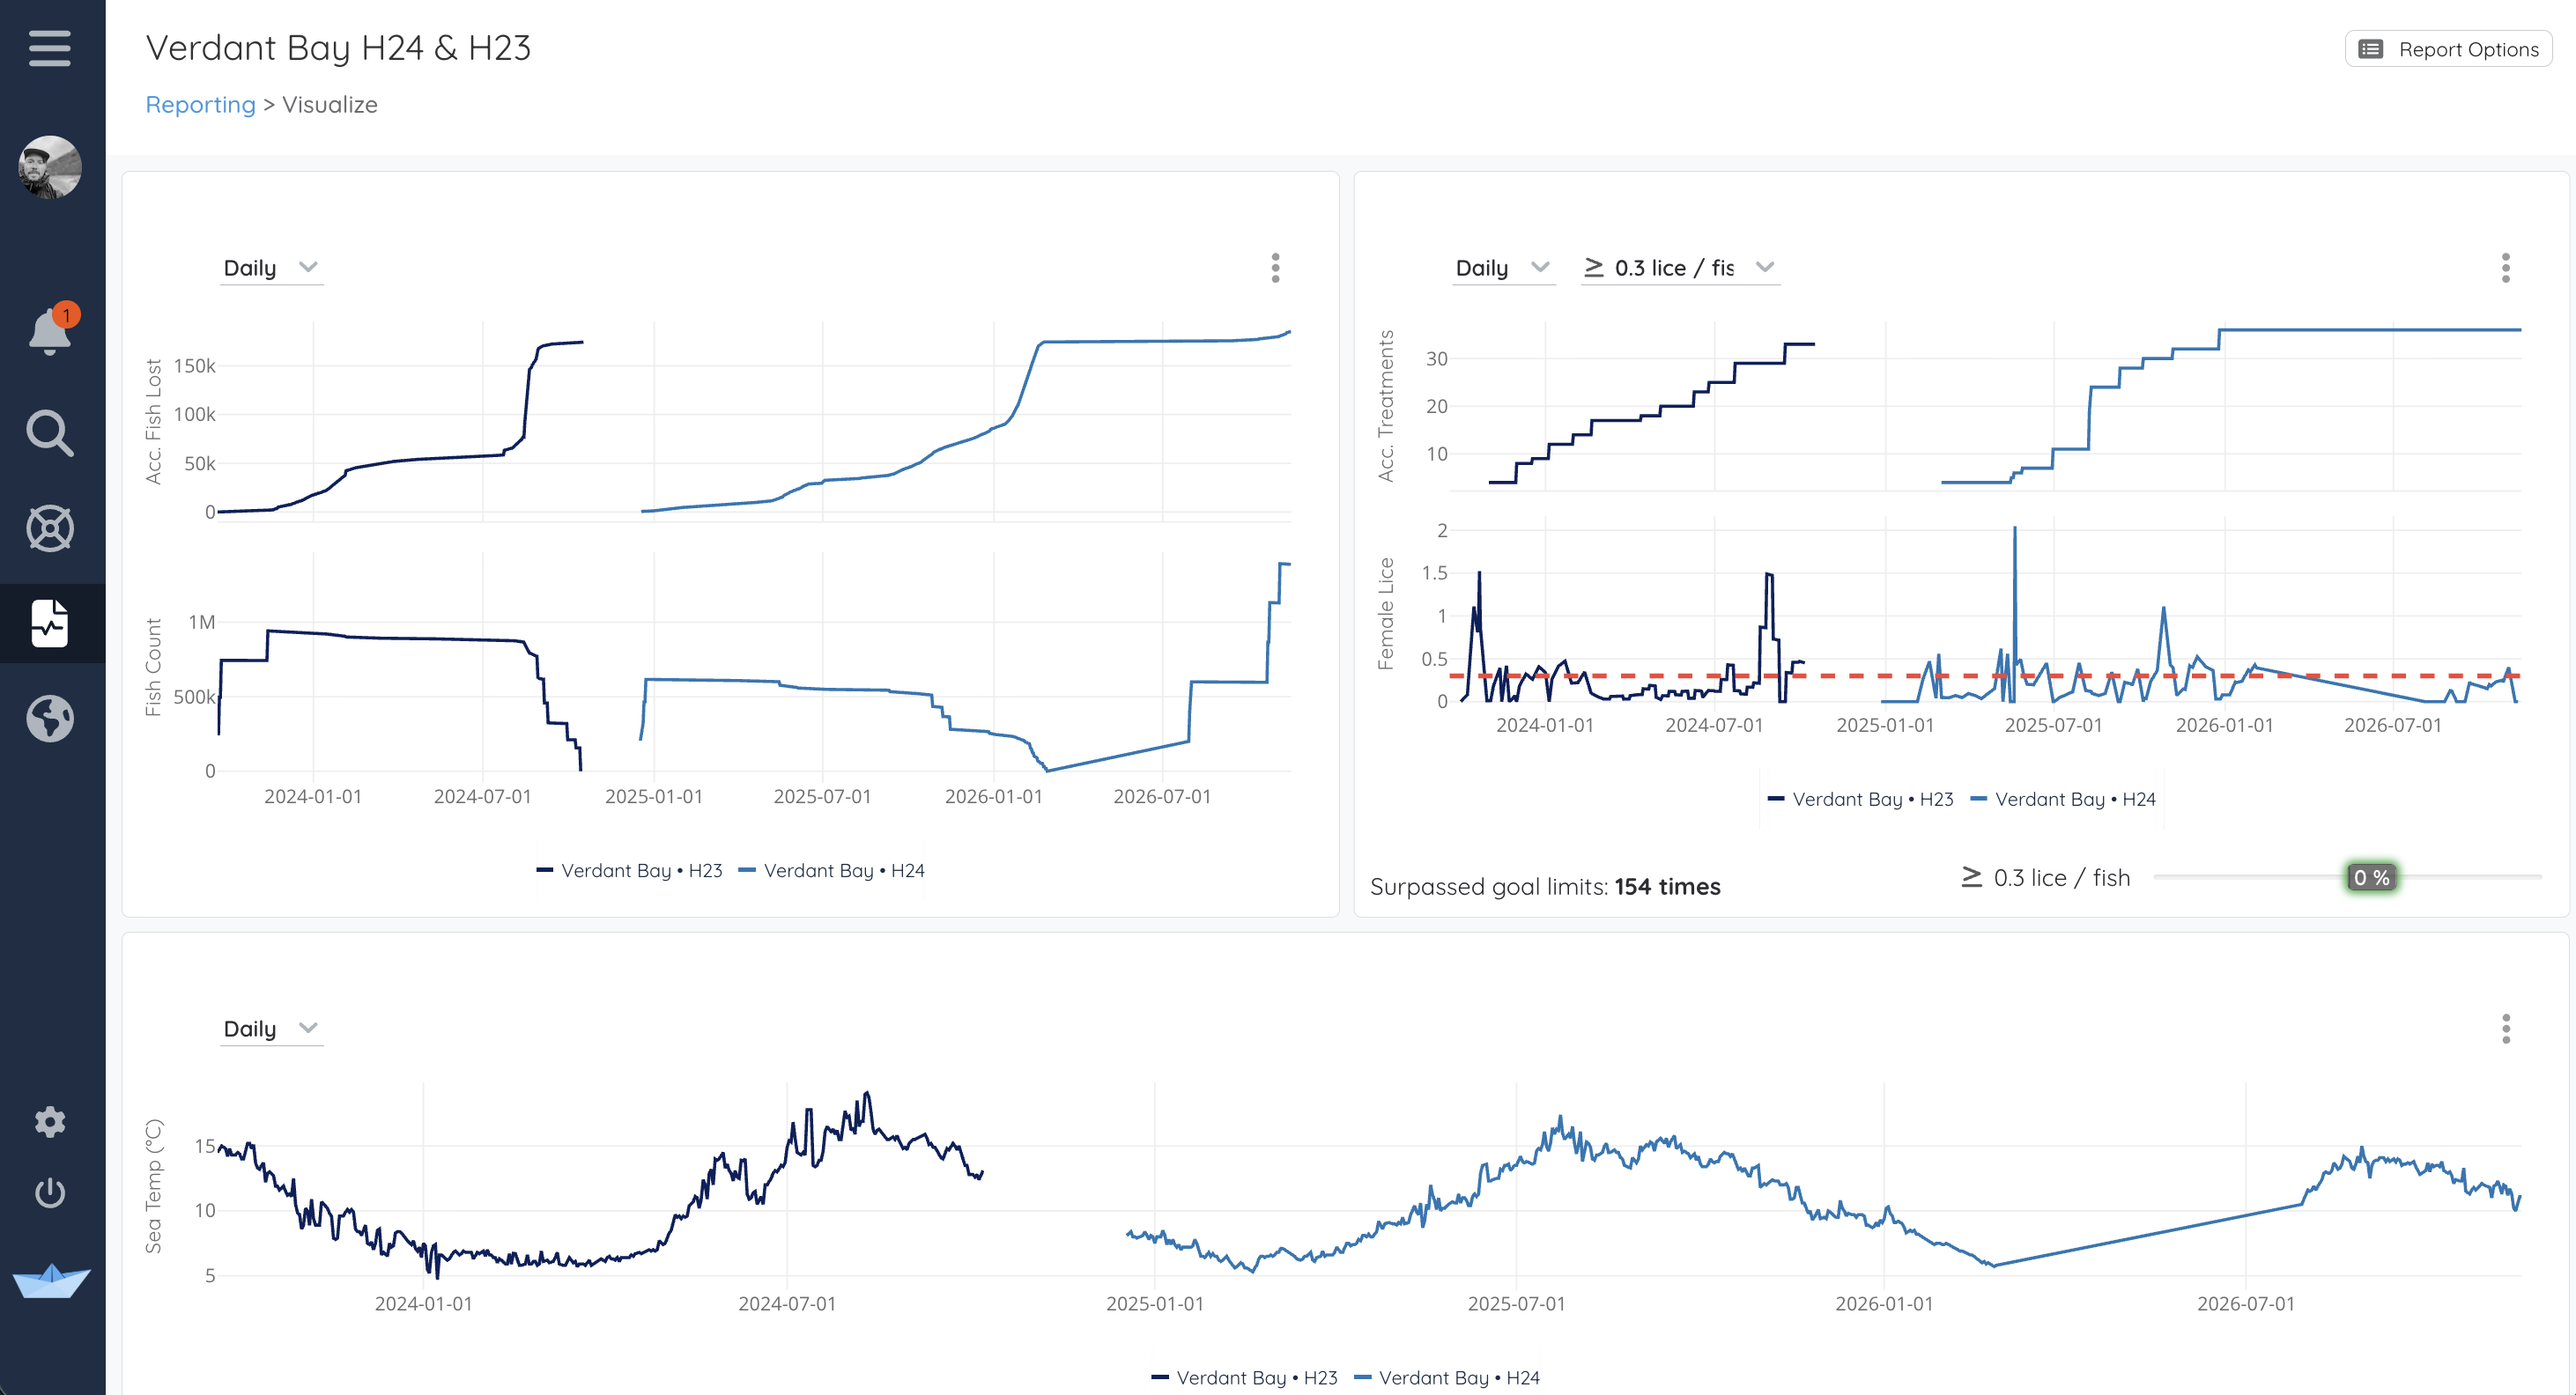
Compare sites and generations, investigate growth and mortality trends, or develop internal models using structured production histories.
Use available Manolin data in your planning tools, internal applications, and decision-support processes. Your teams can keep working in the systems they know.
Access Manolin data through the API without building or maintaining your own lakehouse.

Work with farm records that Manolin has already cleaned and standardized across source systems. No need to reconcile separate exports for every analysis.
| POPULATION ID | COHORT | GEO CLUSTER | PRODUCTION CYCLE | MORTALITY % | FEED eFCR | SGR | HEALTH STATUS | TREATMENTS |
|---|---|---|---|---|---|---|---|---|
| POP-7F21A | C-24B | West Norway | 2025-C | 3.8% | 1.11 | 1.02 | Routine | Hydrogen peroxide |
| POP-84C9D | C-19D | South Chile | 2025-B | 5.1% | 1.14 | 0.98 | Gill challenge | Freshwater + bath |
| POP-31E7B | C-11A | North Atlantic | 2025-C | 6.0% | 1.18 | 0.94 | AGD | Gill support + bath |
| POP-5A92C | C-08F | West Norway | 2025-A | 4.3% | 1.13 | 1.00 | Routine | Cleaner fish + laser |
| POP-62B4E | C-27C | South Chile | 2025-C | 7.2% | 1.21 | 0.91 | SRS pressure | Oral + injectable |
Push Manolin data into notebooks, BI tools, internal applications, or development environments without rebuilding the population context already created inside Watershed.
| site_name | cage | biomass_kg | mortality_pct | avg_weight_g |
|---|---|---|---|---|
| Verdant Bay H24 | Cage 03 | 842500 | 0.18% | 4120 |
| Verdant Bay H23 | Cage 07 | 795400 | 0.22% | 3985 |
| Nordfjord A12 | Cage 11 | 913200 | 0.14% | 4360 |
| Skerry Point B04 | Cage 05 | 688900 | 0.27% | 3840 |
Manolin builds and maintains connections to supported aquaculture systems, so your team doesn't have to manage each integration.
Explore integrations →









WATERSHED API / FAQ
Straightforward answers about API access, existing systems, integrations, and control of your data.
The API comes with Watershed. Use the app, the API, or both.
No. Watershed handles collection, cleaning, and storage. If you already have a warehouse, the API can feed it.
No. Watershed reads from the systems you already run.
The Watershed API returns data combined from your production, camera, sensor, lab, and other systems in one dataset.
Integrations can take from one to four weeks depending on the number of systems and your requirements. Contact our team to discuss the specifics of your data environment.
You do. You can export all of it through the API at any time.
Yes. Watershed works with any farmed species.
BUILD WITH MANOLIN
Tell us which systems you use and what you're building. Manolin handles the source connections and data preparation so your team can work on the analysis, models, and applications it needs.
Talk to us →